A Lesson Plan for Gardening in the Classroom in Alaska, by Jessica Mulvey, An Alaska Master Gardener
two ears of corn, or two blades of grass, to grow upon a spot of ground where
only one grew before, would deserve better of mankind, and do more essential
service to his country, than the whole race of politicians put together.’’ -Jonathan Swift
 |
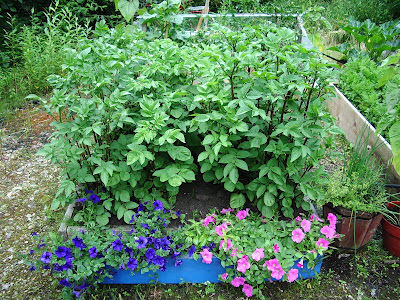
| A small kitchen garden. Photo by Heidi Rader. |
Throughout history, food production has been a driving force
for change and a source of power. Power in the energy it gives our bodies;
power in the hands of those who control production; and now even power in the
form of biofuels. American history has seen many ‘food movements’ – the traditional use of commons; the fraternal
& political Grange Movement; the empowering Victory Gardens of the 20th
century — all focused on the production of food. Roger Doiron, founder of the
nonprofit Kitchen Gardens International, says that, “Over the past 30 years,
we’ve seen food power become concentrated in fewer and fewer corporate hands.’
In a country like ours, whose government was designed in fear of power being
consolidated into fewer hands, it’s no wonder that the strains of public outcry
are being heard. Think back through history & look to the future — food
WAS, IS and ALWAYS WILL BE vital to our individual & national success.
Grade Level: 11-12
Ideal season for lesson: Any or post-WWII
in the US History curriculum.
Time to complete lesson: 2 class periods
Paper clips
Food For Thought Worksheet
Internet access & digital projector “Global Grocer” Food Import Data from Food & Water Watch
Victory Garden Leaders Handbook — (particularly page 18)
Average Crop Yields, Planted Intensively Table
Per-Person Yearly Food Requirement Table
2006 USDA Food Pyramid Recommended Servings Table
Graph paper
Optional: Kitchen Garden Planner program (available for free 30 day trial )
Have improved understanding of historical agricultural & food movements.
Compare food production/sources of the past 50 years to 1950 and earlier.
Interpret data in tables.
Define biodiversity.
Evaluate their family’s nutritional needs.
Create a Home Garden plan.
Learning Activities:
Day One
Pass out the Food For Thought Worksheet with a paper clip attached to each
student’s copy. Ask students how much they think the paper clip weighs. The answer is approximately 1g or the same as an average raisin. Would they be surprised to know that in 2007 the United States imported 64 million pounds of raisins? That would equal about 29,029,911,680 paper clips! Transition to sharing the rest of the startling food facts on the Food For Thought worksheet. Ask students to take notes.
Development:
arise from the consolidation of power. (Activate prior knowledge here as well — consolidation of power in government.)
muscle cuts of beef (including veal), lamb, chicken, goat, and pork; ground beef, ground lamb, ground chicken, ground goat, and ground pork; wild and farm-raised fish and shellfish; perishable agricultural commodities; macadamia nuts; pecans; ginseng; and peanuts. The term perishable agricultural commodity means fresh and frozen fruits and vegetables.
Ask students to share some of the
foods they found & discuss the results of their kitchen inventory.
Development:
Victory Garden Leaders Handbook — (particularly page 18)
Average Crop Yields, Planted Intensively Table
Per-Person Yearly Food Requirement Table
2006 USDA Food Pyramid Recommended Servings
Table
Graph paper
 |
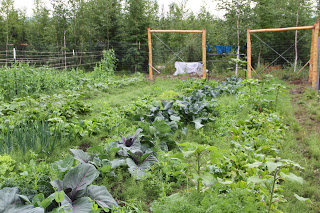
| Heidi Rader’s garden in Fairbanks, Alaska. Photo By Heidi Rader. |
2. Inform students that they are going to use the
information they gathered last night and the data within the following tables
to design a household garden. They are to keep in mind the nutritional needs
& preferences of their families and should be able to support their design
choices with information from the tables. (Optional — suggest that students can
work together in small groups to collaborate and make larger gardens or share
crops.) (Optional technology extension — Use the KGI garden planning program to
design the gardens.) Give students the remainder of the class period to work on
their designs. Check for understanding and progress. Give students time
reminders. If it seems like the class is working well, but slowly, consider
extending the assignment and allowing students to complete as homework or in
class the next day.
Closure: Ask students to quickly write down on a piece of paper : 1) the most interesting thing they learned in the past two days and 2) what they might do differently now that they possess this information.
Alaska Social Studies Standards:
Bibliography:
“Subversive Plots”
2007. Each raisin weighs approximately as much as a paperclip. From 1993 — 2007
the quantity of imported raisins increase 330%[1].
imported. [2]
That equals roughly 771,107 metric tons or 8 Nimitz class aircraft carriers (@97,000
metric tons each). Since the tomatoes are processed they are exempt from COOL —
Country of Origin Labeling.
30,000 products. The majority of these are produced by very large companies,
often with help from their high-ranking regulatory friends.’[3]
Organization, the number of hungry people in the world stands at nearly 1
Billion.’[4]
Cornell University, estimates that the US burns 10 calories of fossil fuel for
every calorie of food energy produced. If the entire world were to eat in the
same energy-hungry way as the US, humanity would exhaust all known global fuel
reserves in just over 7 years.’[5]
sentence for planting a vegetable garden in her front yard. Although gardening
may be socially subversive in the context of today’s food system, it shouldn’t
be against the law.’[6]
cooking & cleanup.’[7]
person, or $9,630 per year. A mini-farm that supplied 85% of those needs would
produce a yearly economic benefit of $8,185
per year — the same as a pretax income of $12,200, except it can’t be
taxed. That would require 2,100 square feet of space and 10 hours a week from
April through September — a total of 240 hours. This works out to the
equivalent of nearly $51 per hour.’[8]
effort “the greatest outdoor fad since miniature golf.’ Every “unprotected
piece of ground was being dug up for victory gardens’. 20 million gardens were
producing 8 million TONS of food — 41% of the vegetable produce consumed in the
nation.
Planted Intensively — (from Mini Farming by Brett L. Markham)
|
Crop
|
Yield in Pounds per 100 Square Feet
|
|
Green beans (as a vegetable)
|
100
|
|
Green beans (dried as protein)
|
20
|
|
Beets (just the roots)
|
200
|
|
Beets (just the greens)
|
200
|
|
Broccoli
|
75
|
|
Cabbage
|
300
|
|
Cauliflower
|
200
|
|
Carrots
|
350
|
|
Chard
|
550
|
|
Corn (on the cob)
|
55
|
|
Corn (dried for cornmeal)
|
18
|
|
Cucumber
|
360
|
|
Eggplant
|
100
|
|
Kale
|
120
|
|
Leeks
|
500
|
|
Leaf Lettuce
|
320
|
|
Head Lettuce
|
180
|
|
Muskmelons
|
100
|
|
Onions
|
300
|
|
Peppers
|
120
|
|
Peas
|
100
|
|
Parsnips
|
290
|
|
Pumpkins
|
120
|
|
Spinach
|
130
|
|
Sunflower (shelled seeds)
|
6
|
|
Summer squash
|
250
|
|
Winter squash
|
200
|
|
Tomatoes
|
250
|
|
Watermelons
|
180
|
|
Barley
|
20
|
|
Oats
|
10
|
|
Rye
|
20
|
|
Wheat
|
20
|
Alaska
Food Requirement— (from Mini Farming by Brett L. Markham)
|
Crop
|
Per-Person Yearly Requirement
|
|
Vegetables
|
456 lbs
|
|
Fruit
|
365 lbs
|
|
Wheat, corn, oats & rice
|
250 lbs
|
|
Total lean meats & eggs
|
159 lbs
|
Pyramid Recommended Servings— (from Mini Farming by Brett L. Markham)
|
Person
|
Grains
|
Vegetables
|
Fruits
|
Milk
|
Meat
|
|
Male, age 25-50
|
11
|
5
|
4
|
2
|
2.8
|
|
Female, age 25-50
|
9
|
4
|
3
|
2
|
2.4
|
|
Teenage male
|
11
|
5
|
4
|
3
|
2.8
|
|
Teenage female
|
9
|
4
|
3
|
3
|
2.4
|
Import Data from Food & Water Watch
|
Food
|
Odds it was Imported
|
Percentage Increase in Imports 1993-2007
|
Top Exporters to the United States
|
|
Raisins
|
1 in 7
|
330%
|
43.5% Chile
42% Argentina
19.8% South Africa
|
|
Grapes
|
1 in 2
|
81%
|
72.6% Chile
23.4% Mexico
1.9% Brazil
|
|
Peaches (canned)
|
1 in 6
|
284%
|
44.3% China
20.8% Greece
|
|
Peaches (fresh)
|
1 in 10
|
43%
|
97.2% Chile
|
|
Pears (canned)
|
1 in 9
|
25,833%
|
67.3% China
25.5% Thailand
3.2% Spain
|
|
Pears (fresh)
|
1 in 4
|
66%
|
48.6% Argentina
22.8% Chile
14% China
|
|
Artichokes (processed & fresh)
|
3 in 4
|
187%
|
40% Peru
24.4% Spain
22.2% Chile
|
|
Peas (canned)
|
1 in 10
|
73%
|
44.4% Canada
16.7% China
11.5% Ecuador
|
|
Olives (canned)
|
4 in 5
|
71%
|
51% Spain
27% Morocco
7.2%Argentina
|
|
Tomatoes (processed)
|
1 in 12
|
213%
|
39.7% Italy
28.5% Canada
11.7% Mexico
|
|
Tomatoes (fresh)
|
1 in 3
|
156%
|
88.7% Mexico
10.4% Canada
.5% Netherlands
|
|
Mushrooms (processed)
|
3 in 4
|
45%
|
57.3% China
13.3% India
9.5% Indonesia
|
|
Mushrooms (fresh)
|
1 in 11
|
2021%
|
73.2% Canada
14% China
6.1% Mexico
|
|
Garlic (processed & fresh)
|
1 in 2
|
318%
|
92.7% China
3.8% Mexico
|
|
Pickles
|
1 in 13
|
393%
|
68.2% India
6.9% Canada
5.1% Poland
|
|
Food
|
Odds it was Imported
|
Percentage Increase in Imports 1993-2007
|
Top Exporters to the United States
|
|
Orange Juice
|
1 in 3
|
34%
|
67.1% Brazil
16.1% Mexico
11.5% Costa Rica
|
|
Oranges
|
1 in 9
|
984%
|
25.2% Australia
24.9% South Africa
19.9% Spain
|
|
Grape Juice
|
1 in 2
|
54%
|
88.1% Argentina
3.7% Chile
3.2% Canada
|
|
Apple Juice
|
4 in 5
|
153%
|
71% China
13.7% Argentina
5.1% Chile
|
|
Apples (fresh)
|
1 in 12
|
65%
|
59.8% Chile
22.9% New Zealand
15% Canada
|
|
Watermelons
|
1 in 6
|
317%
|
86.4% Mexico
5.5% Guatemala
4.4% Honduras
|
|
Strawberries
|
1 in 12
|
402%
|
99.3% Mexico
|
|
Blueberries
|
2 in 5
|
342%
|
48.8% Chile
35.3% Canada
14.9% Argentina
|
|
Raspberries
|
1 in 5
|
1052%
|
60.8% Mexico
22.6% Chile
16.2% Canada
|
|
Apricots
|
1 in 12
|
73%
|
80% Chile
20% New Zealand
|
|
Kiwi
|
4 in 5
|
106%
|
40.7% Chile
36.5% New Zealand
21.3% Italy
|
|
Cantaloupe
|
1 in 3
|
121%
|
48.3% Guatemala
24.6% Honduras
24.4% Costa Rica
|
|
Limes
|
1 in 1
|
280%
|
97.6% Mexico
|
|
Lemons
|
1 in 7
|
660%
|
46.8% Mexico
32% Chile
17.6% Spain
|
|
Cherries
|
1 in 14
|
848%
|
81% Chile
14.5% Canada
2.7% Argentina
|
|
Tangerines & Tangelos
|
1 in 3
|
564%
|
56.9% Spain
10.7% Chile
9.9% Peru
|
|
Food
|
Odds it was Imported
|
Percentage Increase in Imports 1993-2007
|
Top Exporters to the United States
|
|
Grapefruit
|
1 in 18
|
73%
|
72.9% Bahamas
25.5% Mexico
1.1% Israel
|
|
Asparagus
|
3 in 4
|
288%
|
56.6% Peru
41.7% Mexico
|
|
Eggplant
|
2 in 5
|
177%
|
76.9% Mexico
20.1% Honduras
1.5% Canada
|
|
Carrots
|
1 in 11
|
74%
|
64.9% Canada
30% Mexico
4.4% Costa Rica
|
|
Cucumbers
|
1 in 2
|
102%
|
82.9% Mexico
11.4% Canada
4.3% Honduras
|
|
Broccoli
|
1 in 10
|
480%
|
93.7% Mexico
6.3% Canada
|
|
Bell Peppers
|
1 in 3
|
170%
|
72.2% Mexico
21.6% Canada
2.9% Netherlands
|
|
Green Beans
|
1 in 9
|
177%
|
77.2% Mexico
20.5% Guatemala
.7% Canada
|
|
Squash/Zucchini
|
2 in 5
|
133%
|
93.4% Mexico
2.6% Costa Rica
1.3% Honduras
|
|
Potatoes
|
1 in 11
|
55%
|
99.9% Canada
|
|
Avocados
|
3 in 5
|
4149%
|
62.9% Mexico
32% Chile
4.4% Dominican Republic
|
|
Onions
|
1 in 7
|
80%
|
52% Mexico
17.1% Canada
15.5% Peru
|
Ibid.
Ibid.
Ibid.
Ibid.
Ibid.
Markham, Brett L. Mini Farming — Self-Sufficiency on ¼ Acre, Skyhorse Publishing,
New York, 2010, pg. 20
About Heidi Rader
Twitter •
